Why mortgage origination keeps getting more expensive


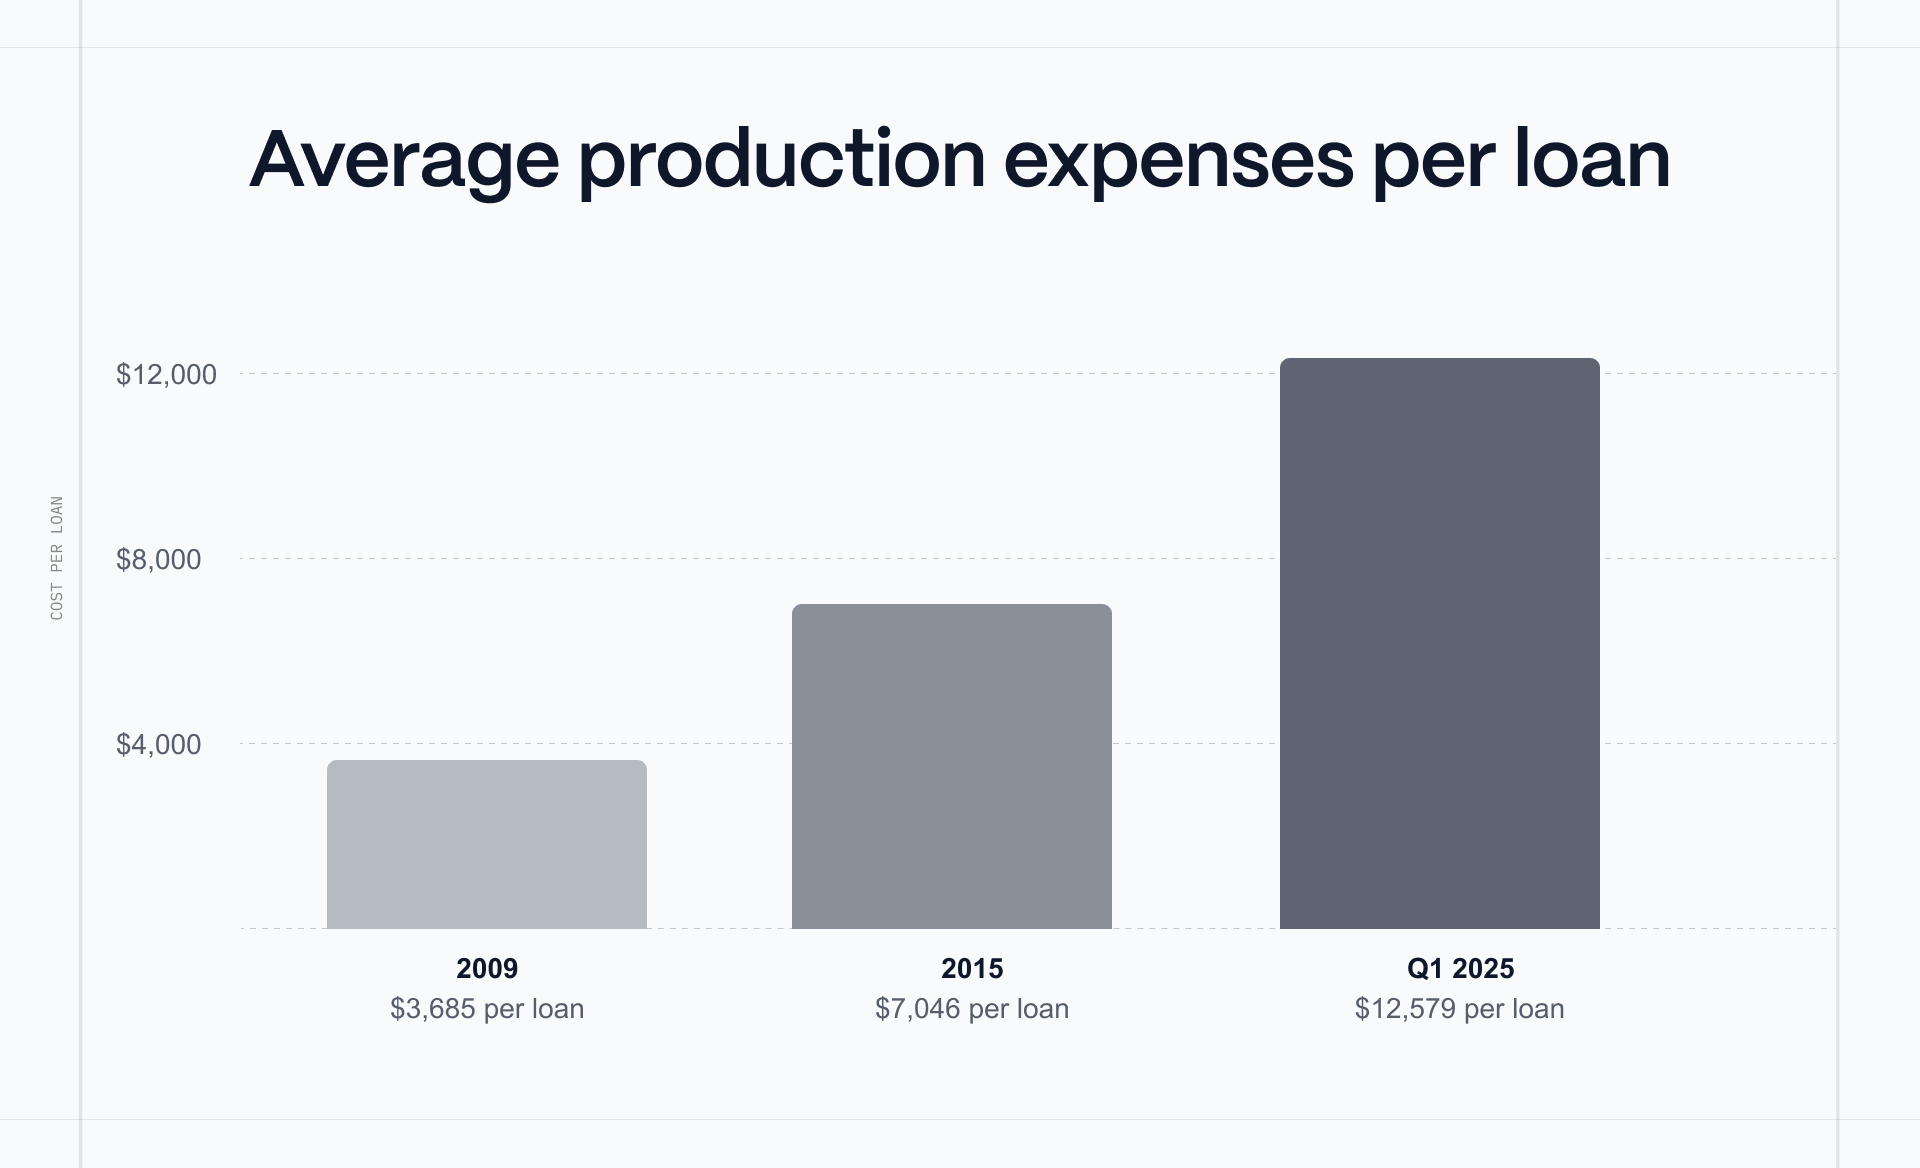
In 2009, the average cost to originate a mortgage was $3,685 per loan. By Q1 2025, that figure had climbed to $12,579, the highest cost ever recorded by the Mortgage Bankers Association. This surge in costs occurred during a period when the mortgage industry invested more in technology than in any previous era: digital point-of-sale platforms, automated underwriting systems, document management tools, compliance engines, pricing analytics, and dozens of other specialized solutions.
In virtually every other financial services category, technology investment of this magnitude has driven costs down. Insurance underwriting that once took weeks now happens in minutes. Consumer lending that required branch visits now closes instantly on mobile devices. Payment processing that relied on checks and multi-day transfers now settles in seconds. Yet mortgage origination, despite deploying more technology than ever, has become dramatically more expensive.
This is the mortgage efficiency paradox: the overall cost trajectory has moved in the opposite direction from what innovation should have delivered. The explanation doesn’t lie with any single technology or vendor, but rather in how the industry’s underlying architecture interacts with the tools layered on top of it. As we’ll see, the rising cost of origination reflects a set of structural forces, including integration complexity, fixed-cost rigidity, and the compounding effects of fragmentation, that individual point solutions have been unable to address.
In previous posts, we traced the mortgage factory’s origins, walked through its mechanics station by station, and examined the stakeholders shaped by the assembly line model. In this post we turn to economics: what the cost data reveals, why technology investment has failed to bend the curve, and what this means for the originators bearing the financial consequences.
The cost trajectory
The MBA’s Quarterly Mortgage Bankers Performance Report, which has tracked origination costs since Q3 2008, provides the most consistent data series available on the cost to produce a mortgage. The trajectory is striking. Average production expenses per loan were approximately $4,700 in 2008 and dropped to $3,685 in 2009, when high refinance volume spread fixed costs across more loans. Through the mid-2010s, costs settled around $7,000 per loan, with the annual figure reaching $7,046 in 2015. From there, costs escalated rapidly: $8,611 by Q4 2018, $10,624 in 2022, and $12,579 in Q1 2025.
Some of this trajectory reflects volume dynamics. Per-loan costs are partly a function of how many loans a lender originates in a given period: when volume is high, fixed costs get spread across more loans, and per-loan figures come down. When volume drops, the same fixed costs concentrate on fewer loans, and per-loan figures spike. The lowest per-loan cost in the MBA’s data ($3,685 in 2009) corresponded with a refinance-driven volume surge, while the highest ($12,579 in Q1 2025) came during a period of constrained volume.
But volume alone does not explain the trend. The MBA reported that from 2008 through 2018, production expenses averaged approximately $6,200 per loan across all volume environments. More recently, even in quarters with improving volume, costs have remained above $11,000 per loan. This suggests a structural increase in the cost base that persists through volume fluctuations. Something about the system itself has become more expensive to operate.
Why costs climbed despite innovation
Observing that origination costs have steadily increased is not the same as saying that technology investment has been wasted. Digital applications reduced data entry compared to paper forms. Automated underwriting systems cut initial credit decisioning from days to minutes. Document management platforms improved organization and retrieval. Compliance engines automated regulatory checks that once required manual review. Each of these innovations addressed a real pain point and delivered measurable improvements within its domain.
The problem is what happened in the aggregate. New systems were deployed alongside existing infrastructure rather than replacing it. Lenders adopted digital POS platforms but maintained their legacy loan origination systems. They implemented automated underwriting but still needed human underwriting teams to validate results and handle exceptions. They purchased document automation tools but still required processors to manage workflows between systems. Each new tool was effective in isolation, but collectively they created a new category of cost: integration complexity.
The integration tax
A typical enterprise lender today maintains 15-20 separate vendor solutions. Each vendor brings its own data model, its own database structure, and its own approach to organizing loan information. When borrower data moves from the POS to the LOS, it must be mapped between different structures, often requiring manual validation. When loan data moves from the LOS to pricing engines to document generation systems to investor portals, each transition requires translation, verification, and, often, re-entry. IT teams spend significant resources building and maintaining custom connections between systems, and a change to one system often breaks connections to others.
The result is that human workers have increasingly become the integration layer: the people who manually move information between systems, reconcile discrepancies, and coordinate handoffs that the technology itself cannot manage. This is the efficiency paradox in its most concrete form. Each point solution makes a specific task faster, but adds another system that must be integrated, another vendor relationship to manage, another seam where human coordination is required. The more technology gets layered onto the mortgage assembly line, the more coordination the assembly line demands.
Freddie Mac’s 2024 Cost to Originate study found that third-party fees now account for a substantial portion of origination expenses, with particular increases in technology subscriptions and verification services. Where a lender in 2008 might have paid for an LOS and a handful of vendor relationships, a lender today maintains contracts with 15 or more separate providers, each requiring licensing fees, implementation costs, training, and ongoing support.
Rising wages for roles that haven’t been eliminated
Technology has reduced the total human hours required per mortgage compared to what a fully manual process would demand at today’s regulatory standards. Imagine originating a mortgage with 2025 compliance requirements and 1950s tools: no electronic document storage, no automated underwriting, no digital communication with borrowers.
But technology has not eliminated the specialized roles that the assembly line requires. Lenders still employ processors to gather and organize documentation, underwriters to evaluate risk, closers to coordinate execution, QC analysts to verify quality, and compliance staff to ensure regulatory adherence. These roles require state licensing, extensive training (typically 6-12 months to proficiency), and deep knowledge of investor guidelines. They cannot be easily offshored for regulatory and licensing reasons.
And the cost of this workforce has risen. Personnel expenses consistently represent roughly 60 to 65 percent of total production costs according to MBA data, a share that has remained remarkably stable even as lenders have invested heavily in technology. Benefits costs have accelerated as well: according to data from the MBA and STRATMOR Peer Group Roundtables Program, employer-paid benefits costs for mortgage production staff grew faster from 2020 to 2025 than during the prior five-year period from 2015 to 2020.
The net effect is that technology reduced the hours required per task but did not reduce the number of specialized roles required to staff the assembly line. Meanwhile, wages for those roles have increased, driven by competition for licensed talent, post-crisis regulatory requirements, and general labor market dynamics. The savings from making individual tasks faster have been offset by the rising cost of the human workforce that still performs them.
Regulatory complexity, amplified by fragmentation
Post-2008 regulations added real complexity to mortgage origination. The Dodd-Frank Act and subsequent rules mandated additional documentation, disclosure requirements, quality control measures, and consumer protections.
While some of the increased regulatory cost is inherent to the requirements themselves, some is also amplified by the architecture of the systems that implement them. A compliance check that should be a simple data validation, such as confirming that a borrower’s debt-to-income ratio falls within program guidelines, becomes expensive when the relevant data lives in three different systems with three different data models. Similarly, a disclosure that could be generated automatically may instead require manual coordination when the system generating it doesn’t have real-time access to the loan data it needs. A regulatory change that should be implemented once, across all active files, instead requires updates to multiple disconnected platforms, retraining of staff on new procedures in each system, and manual quality checks to ensure consistency.
The cost of compliance, in other words, is partly a function of the fragmented architecture through which compliance is managed. The same requirements could be met at a fraction of the cost if the underlying data lived in a unified system with guidelines encoded from the start. Instead, compliance layers have been added on top of existing, fragmented infrastructure, compounding the coordination burden rather than simplifying it.

The fixed-cost trap
The mortgage assembly line’s cost structure is overwhelmingly fixed. Processors, underwriters, closers, and compliance staff are salaried employees who require compensation regardless of how many loans come through the door. Enterprise LOS licenses, vendor subscriptions, and compliance infrastructure often require minimum annual commitments or per-seat pricing that doesn’t flex proportionally with volume. The overhead of maintaining a compliant mortgage operation has a floor that must be met whether a lender originates 100 loans per month or 1,000.
This creates a structural vulnerability that is unique in its severity among financial services businesses. Mortgage volume fluctuates dramatically based on interest rate movements: the MBA estimated that origination volume declined approximately 40 percent between 2021 and 2023 before beginning to recover in 2024. But the specialized workforce that operates the assembly line cannot be scaled down proportionally. Hiring and training a qualified underwriter takes months. Laying off experienced staff means losing institutional knowledge that takes years to rebuild, and risking being unable to serve borrowers when volume returns.
The profitability data reveals just how punishing this dynamic is. In 2023, IMBs reported an average loss of $1,056 per loan originated, the worst annual result in the 15-year history of MBA’s tracking. In Q4 2023 specifically, losses reached $2,109 per loan. While 2024 saw a recovery to modest profitability at $443 per loan on average, smaller lenders with annual production under $500 million continued to report losses for a third consecutive year. As MBA Vice President Marina Walsh noted in October 2025, “origination costs are still elevated” and “many lenders are exploring ways to reduce origination costs and increase productivity through technology advances and process improvement.”
The MBA’s own analysis has isolated the volume effect from the spending effect. In a July 2023 study of repeater companies reporting consistently from 2018 through 2023, the MBA found that gross production expenses per firm had actually declined by more than 58 percent from their 2020 peak. Lenders were spending less in absolute terms. But per-loan costs rose continuously through Q1 2023 because the fixed cost base, even after significant cuts, was being spread across far fewer loans. This is the fixed-cost trap in action: even disciplined cost management cannot prevent per-loan costs from spiking when volume falls.
This structural inflexibility is one of the most consequential features of the mortgage factory model. It means that profitability depends more on volume (which lenders cannot control, since it’s driven by interest rates and housing market conditions) than on operational efficiency (which lenders theoretically can control). An industry built on variable-cost infrastructure, where the cost of each loan scales with volume rather than remaining fixed, would be more structurally resilient. But the assembly line model, with its specialized departments and dedicated human roles, is the opposite of variable-cost.
The quality assurance paradox
The mortgage industry invests more in quality control than at any point in its history. Pre-closing reviews, post-closing reviews, investor quality control upon delivery, and ongoing servicing audits create multiple layers of scrutiny for every loan. Specialized QC vendors employ sophisticated tools and trained analysts. Compliance technology checks loan data against hundreds of rules and regulations.
Critical defect rates tracked by ACES Quality Management have shown improvement in recent periods, with the average rate falling to 1.52% for calendar year 2024, down from prior years. Q4 2024 saw the rate reach 1.16%, the second-lowest level ever recorded. But these improvements have come alongside persistent volatility in specific categories: legal/regulatory/compliance defects rose in Q4 2024, insurance-related defects spiked in 2024 due to market turbulence, and income/employment defects surged 42.5% in Q1 2025 to reclaim the top defect category.
The pattern suggests that as the industry resolves one category of defects, new categories emerge. This is characteristic of a system where errors are introduced by architectural fragmentation, including manual data entry across systems, handoffs between departments, and inconsistent guideline application by different reviewers, and where those errors are only caught by after-the-fact review layers. Adding more review layers catches more errors, but doesn’t prevent them from being introduced in the first place.
For originators, the quality control investment translates directly into cost. The extensive documentation and verification requirements exist in large part to satisfy the repurchase frameworks imposed by downstream investors. When Fannie Mae, Freddie Mac, or private investors discover defects post-purchase, they can require lenders to repurchase loans, creating significant financial exposure. This repurchase risk drives conservative underwriting behavior: underwriters request extensive documentation to protect against exposure, even when the marginal value of additional verification is low. Better to over-document than face repurchase consequences.
A system that validated data continuously against investor guidelines from the first keystroke, rather than retroactively through multiple review layers, would prevent most defects from being introduced, reducing the need for the extensive and expensive after-the-fact quality control apparatus that characterizes the assembly line. This is a structural opportunity, not a technology gap: the capability exists, but it requires an architecture where guidelines are encoded into the workflow rather than applied retroactively by human reviewers working in disconnected systems.
The timeline gap
The actual touch time required to originate a mortgage (the hours a human spends actively working on the file) ranges from a few hours for straightforward scenarios to 50 or more hours in complex cases. Yet the calendar time from application to closing typically falls in the range of 30 to 45 days.
Some of this gap reflects genuinely time-consuming third-party processes. Appraisals require a licensed appraiser to physically visit and assess the property, with turnaround times ranging from a few days to two weeks or more depending on market conditions. Title research requires reviewing county records and legal documents. Federal regulations mandate minimum waiting periods, such as the seven-business-day waiting period between the Loan Estimate and consummation required under TRID. These requirements cannot be meaningfully compressed.
But a substantial portion of the gap is queue time between handoffs: files waiting for the next available processor, waiting for an underwriter to be assigned, waiting while conditions are gathered and resubmitted, waiting while closing is scheduled among multiple parties. And then there’s the conditions loop, where underwriting conditions that might have been identified at application instead surface days or weeks into the process, sending the file backward through steps that were already complete. Each round of this cycle adds days of elapsed time.
Some lenders have achieved faster timelines for straightforward scenarios. But for most of the industry, the 30-to-45-day window persists because all scenarios, simple and complex alike, move through the same sequential workflow. A straightforward refinance with a W-2 borrower, clean credit, and a standard property navigates the same assembly line as a complex self-employed purchase with a non-warrantable condo. The architecture doesn’t differentiate.
Extended timelines create tangible costs for every participant. Borrowers risk purchase contract deadlines, potentially losing earnest money deposits. Rate locks can expire if timelines extend, requiring repricing. Lenders have capital tied up in warehouse lines, incurring carrying costs for each day between funding and investor sale. Brokers have compensation at risk for 30 to 45 or more days while managing borrower expectations and navigating delays they cannot control.
What this adds up to
The U.S. mortgage industry originates millions of loans annually. At a cost of roughly $12,000 per loan, total origination costs amount to tens of billions of dollars each year. How much of this is inherent to mortgage complexity, and how much reflects systemic inefficiency?
Comparing mortgages to simpler loan products isn’t entirely fair, given the genuine complexity of property valuation, title research, and regulatory requirements. But the evidence suggests substantial addressable waste. Data re-entered multiple times across disconnected systems is waste. Queue time between handoffs is waste. The conditions loop, which exists because the assembly line separates decision-makers from document gatherers rather than encoding guidelines into the workflow from the start, is waste. The human coordination required to stitch together 15 or more vendor systems is waste.
For originators, this inefficiency translates directly into compressed margins, structural vulnerability to volume cycles, and limited ability to compete on price. Independent mortgage banks, which bear the full weight of the assembly line’s fixed costs, are profitable in good quarters and lose money in bad ones, with profitability driven more by macroeconomic conditions than by operational excellence. Smaller lenders, who lack the volume to spread fixed costs effectively, face the worst economics: MBA data shows lenders with less than $500 million in annual production posting average losses for three consecutive years through 2024.
Brokers experience the cost burden through the rates and compensation structures offered by wholesale lenders. As wholesale lenders’ operational costs rise, those costs flow through in rate sheets and compressed broker margins. Brokers who once captured 1.5 to 2 percent of loan value increasingly work with tighter economics while managing the same or greater operational complexity across multiple lender relationships.
The impact extends beyond originator economics. Origination costs must be recovered somewhere, and they are typically embedded in the interest rates borrowers pay. Housing affordability is already stretched to historic limits, with home prices up more than 50 percent since 2019 while median household income has risen only about 24 percent according to the National Association of Home Builders. The mortgage factory’s operational overhead creates an additional burden on homeownership. The share of first-time buyers has dropped to 21 percent in 2025, the lowest level in decades, and the median age of first-time buyers has reached a record high of 40. For every basis point of rate reduction that more efficient origination infrastructure could deliver, there are borrowers on the margin for whom that difference determines whether homeownership is attainable.
The architecture is the problem
The mortgage factory’s rising costs are not the result of insufficient investment or inadequate tools. They are the result of layering increasingly sophisticated solutions onto a fundamentally fragmented architecture: one that was designed around sequential human handoffs, specialized departments, and disconnected systems.
Each new point solution adds capability, but also adds another system to integrate, another vendor to manage, and another seam where human coordination is required. The assembly line absorbs each innovation without structurally changing, and the coordination overhead grows. Meanwhile, wages for the specialized workforce rise. Compliance costs multiply as workflows propagate across disconnected platforms. And the underlying fixed-cost structure keeps costs persistently high regardless of volume, exposing originators to painful losses whenever the market contracts.
Since the architecture of the mortgage factory is the primary driver of the efficiency paradox, the answer cannot be to layer another point solution onto the same assembly line. Instead, we must be willing to rethink the architecture itself. Such a paradigm shift may be uncomfortable for vendors who thrive in an environment of complexity. But for everyone else, automated and efficient mortgage origination will unlock the margin relief, borrower affordability, and operational resilience that the mortgage factory has failed to deliver.
Sources
Mortgage Bankers Association. “IMBs Report Slight Production Losses in First Quarter of 2025.” May 16, 2025. https://www.mba.org/news-and-research/newsroom/news/2025/05/16/imbs-report-slight-production-losses-in-first-quarter-of-2025
Mortgage Bankers Association. “Independent Mortgage Bankers Post Net Production Profits in 2024.” April 17, 2025. https://www.mba.org/news-and-research/newsroom/news/2025/04/17/independent-mortgage-bankers-post-net-production-profits-in-2024
Mortgage Bankers Association. “MBA Forecast: Total Single-Family Mortgage Originations to Increase 8 percent to $2.2 Trillion in 2026.” October 19, 2025. https://www.mba.org/news-and-research/newsroom/news/2025/10/19/mba-forecast–total-single-family-mortgage-originations-to-increase-8-percent-to–2.2-trillion-in-2026
Mortgage News Daily. “Mortgage Lender Profits, Pull-Through, and Production Improve in 2009.” June 30, 2010. https://www.mortgagenewsdaily.com/news/06302010-mba-industry-profits
Mortgage News Daily. “Mortgage Banking Profits Increased in 2016.” April 13, 2017.
MortgageOrb. “MBA: Cost To Originate A Mortgage Hit New Peak In Q1 At $8,887 Per Loan.” June 7, 2017. https://mortgageorb.com/mba-cost-originate-mortgage-hit-new-peak-q1-8887-per-loan
HousingWire. “Mortgage profitability hits all-time low in Q4.” September 19, 2019. https://www.housingwire.com/articles/48577-mortgage-profitability-hits-all-time-low-in-q4/
HousingWire. “Average IMB lost $2,812 per origination in Q4.” March 17, 2023. https://www.housingwire.com/articles/average-imb-lost-2812-per-origination-in-q4/
MBA Newslink. “MBA Chart of the Week July 17, 2023: IMB Production Expenses Vs. Gross Production Expenses.” July 17, 2023. https://newslink.mba.org/mba-newslinks/2023/july/mba-newslink-tuesday-july-18-2023/mba-chart-of-the-week-july-17-2023-imb-production-expenses-vs-gross-production-expenses/
Freddie Mac. “2024 Cost to Originate Study.” 2024. https://sf.freddiemac.com/articles/insights/2024-cost-to-originate-study
Freddie Mac. “2025 Updates to the Cost to Originate Study.” 2025. https://sf.freddiemac.com/articles/insights/2025-updates-to-the-cost-to-originate-study
US REO Partners. “MBA Chart of the Week: Employee Benefits Costs for Residential Mortgage Lenders and Servicers.” January 2, 2026. https://usreop.com/mba-chart-of-the-week-employee-benefits-costs-for-residential-mortgage-lenders-and-servicers-jan-2-2026/
ACES Quality Management. “Q4/CY 2024 Mortgage QC Industry Trends Report.” May 15, 2025. https://www.acesquality.com/resources/reports
ACES Quality Management. “Q1 2025 Mortgage QC Industry Trends Report.” August 2025. https://www.acesquality.com/resources/reports/q1-2025-aces-mortgage-qc-industry-trends
HousingWire. “MBA economists: The overcapacity that still needs to be cut.” November 8, 2022. https://www.housingwire.com/articles/mba-economists-the-overcapacity-that-still-needs-to-be-cut/
National Association of Home Builders. “Impact of Affordability Challenges and Demographic Shifts on Housing Trends in 2026.” February 2026. https://www.nahb.org/news-and-economics/press-releases/2026/02/impact-of-affordability-challenges-and-demographic-shifts-on-housing-trends-in-2026
National Mortgage News. “MBA says productivity, origination pull-through is falling.” October 20, 2025. https://www.nationalmortgagenews.com/news/mba-says-productivity-origination-pull-through-is-falling
